Ultrasonic Wave Propagation Review
1. Introduction
Ultrasonic refers to any study or application of sound waves that are higher frequency than the human audible range. Ultrasonic waves consist of frequencies greater than 20 kHz and exist in excess of 25 MHz. Ultrasonic waves are used in many applications including plastic welding, medicine, jewelry cleaning, pipe inspection, and nondestructive test. Within nondestructive test, ultrasonic waves give us the ability to “see through” solid/opaque material and detect surface or internal flaws without affecting the material in an adverse manner.
2. Basic Principles of Ultrasonic Testing
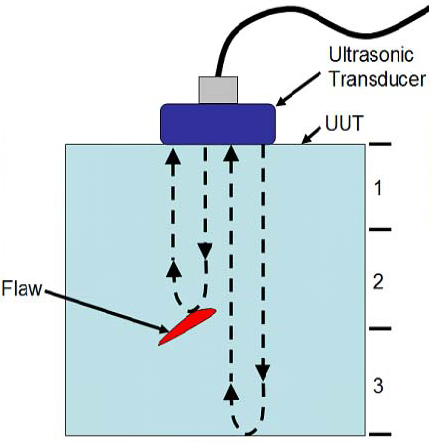
Ultrasonic Testing (UT) uses high frequency sound energy to conduct examinations and make measurements. Ultrasonic inspection can be used for flaw detection/evaluation, dimensional measurements, material characterization, and more. To illustrate the general inspection principle, a typical pulse/echo inspection configuration as illustrated below will be used.
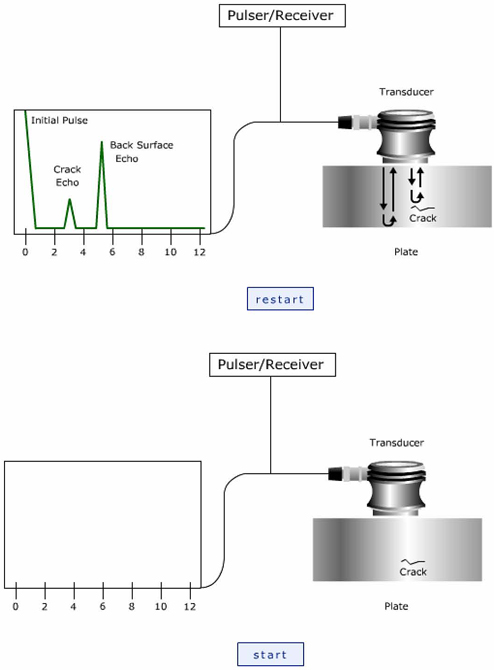
A typical UT inspection system consists of several functional units, such as the pulser/receiver, transducer, and display devices. A pulser/receiver is an electronic device that can produce high voltage electrical pulses. Driven by the pulser, the transducer generates high frequency ultrasonic energy. The sound energy is introduced and propagates through the materials in the form of waves. When there is a discontinuity (such as a crack) in the wave path, part of the energy will be reflected back from the flaw surface. The reflected wave signal is transformed into an electrical signal by the transducer and is displayed on a screen.
In the applet below, the reflected signal strength is displayed versus the time from signal generation to when an echo was received. Signal travel time can be directly related to the distance that the signal traveled. From the signal, information about the reflector location, size, orientation and other features can sometimes be gained.
Ultrasonic Inspection is a very useful and versatile NDT method (Non-Destructive Testing). Some of the advantages of ultrasonic inspection that are often cited include:
- It is sensitive to both surface and subsurface discontinuities.
- The depth of penetration for flaw detection or measurement is superior to other NDT methods.
- Only single-sided access is needed when the pulse-echo technique is used.
- It is highly accurate in determining reflector position and estimating size and shape.
- Minimal part preparation is required. (will be discussed in chap.3)
- Electronic equipment provides instantaneous results.
- Detailed images can be produced with automated systems.
- It has other uses, such as thickness measurement, in addition to flaw detection.
As with all NDT methods, ultrasonic inspection also has its limitations, which include:
- Surface must be accessible to transmit ultrasound.
- Skill and training is more extensive than with some other methods.
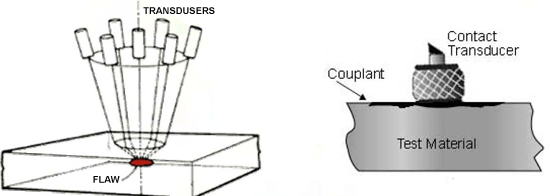
- It normally requires a coupling medium to promote the transfer of sound energy into the test specimen.
- Materials that are rough, irregular in shape, very small, exceptionally thin or not homogeneous are difficult to inspect.
- Cast iron and other coarse grained materials are difficult to inspect due to low sound transmission and high signal noise.
- Linear defects oriented parallel to the sound beam may go undetected.
- Reference standards are required for both equipment calibration and the characterization of flaws.
3. Minimal part preparation of NDT
- Scope
Introductory statement
The NDT method concerned
A summary of the technique
Details of the material, component type, thickness range, test area, etc. - Standards and References
A list of relevant standards and reference documents, including source, number and title.
- Definitions
- Safety
- Personnel
- Identifications and Reference Points
- Surface Preparation
- Extent of Inspection
- Equipment Specification
- Equipment Calibration
- Equipment Checks
- Technique Detail
- Assessment of Test Results
The procedure must specify the minimum size, or type of indication to be recorded, and the defect classification and sizing method to be employed. A statement should be made that defects are to be located with respect to defined datum.
- Reporting Of Test Results
- Procedure reference
- Component
- Equipment data
- Settings/sensitivity
- Location of defects
- Status of defects, e.g. accept, reject or simply record, against agreed standard code or specification
- Operator name and qualification
- Date of test
- Operator's and for supervisor's signature
- Non-Compliance Statement
- Attachments
A statement on the use of standard definitions, source(s), together with definitions of nonstandard terms used which, if not defined, could lead to ambiguity, and a list of abbreviations used in the text of the procedure.
A general statement that, before application, the tester shall be familiar with the relevant regulations covering health & safety and hazardous substances, both local and statutory, appropriate to the test method.
The minimum requirements for training, certification and experience of NDT operators and supervisors.
Identification of the material, weld or component to be inspected.
The means of marking reference points to ensure repeatability of test results or the future location of defects.
The standard or level of cleanliness, surface finish and/or flatness required, together with details of the precise extent of the area to be prepared.
Specify the precise extent of the test zones, e.g. "Test weld ", "Test all surfaces", etc.
Should include type(s) of equipment to be used, details of any specifications or requirements to be met, as well as additional equipment to be used during the test, e.g. probes, calibration pieces, standards, film etc,
Method of, and requirements for, calibration of system and system elements, including records.
What functional checks are to be performed and when.
Formal records of functional checks.
The action to be taken in the event that the equipment fails a functional check.
Shall define the essential elements of the technique, equipment settings and any other parameters required for the preparation of an NDT Instruction by a Level 2 person i.e. double wall single image, Post emulsified fluorescent etc. Test sensitivity, Scan paths, Probe angles, Exposure details.
Should include essential data for the report and the requirements of the relevant standard or code, e.g.
A statement describing the actions to be taken by the operator in the event of an inability to comply with the procedural requirements.
Should include a listing of any additional materials provided to assist the operator, e.g. drawings, equipment schedules etc
4. Wave Propagation
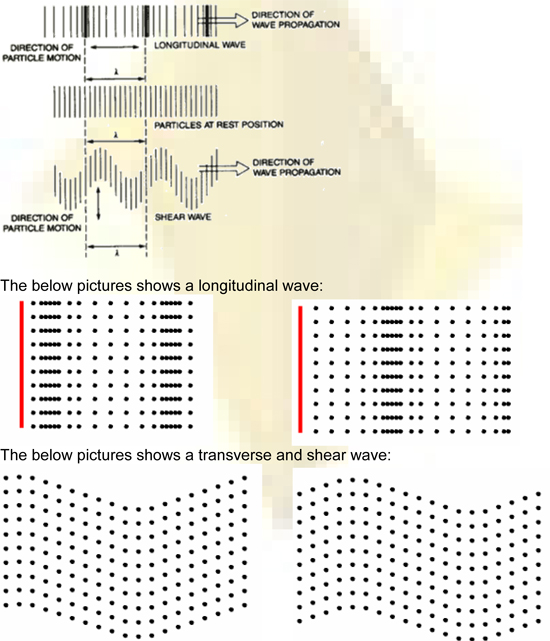
In solids, sound waves can propagate in four principle modes that are based on the way the particles oscillate. Sound can propagate as longitudinal waves, shear waves, surface waves, and in thin materials as plate waves. Longitudinal and shear waves are the two modes of propagation most widely used in ultrasonic testing. The particle movement responsible for the propagation of longitudinal and shear waves is illustrated below.
5. Wavelength and Flaw Detection
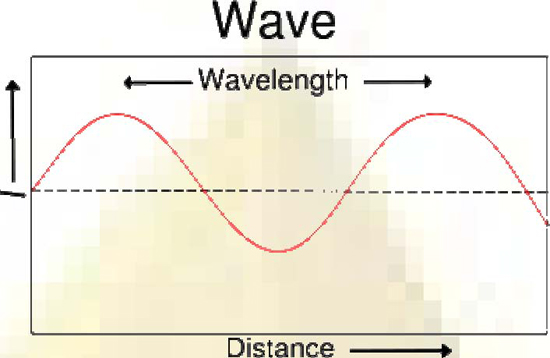
In general, the wavelength is the distance between repeating units of a wave pattern.
λ=vw / f
Where:
λ= wavelength of a sound wave or electromagnetic wave
vw is the speed of propagation of the wave
f = frequency of the wave in 1/s = Hz.
In ultrasonic testing, the inspector must make a decision about the frequency of the transducer that will be used. As we learned previously, changing the frequency when the sound velocity is fixed will result in a change in the wavelength of the sound. The wavelength of the ultrasound used has a significant effect on the probability of detecting a discontinuity. A general rule of thumb is that a discontinuity must be larger than one-half the wavelength to stand a reasonable chance of being detected.
Sensitivity and resolution are two terms that are often used in ultrasonic inspection to describe a technique's ability to locate flaws. Sensitivity is the ability to locate small discontinuities. Sensitivity generally increases with higher frequency (shorter wavelengths). Resolution is the ability of the system to locate discontinuities that are close together within the material or located near the part surface. Resolution also generally increases as the frequency increases. The wave frequency can also affect the capability of an inspection in adverse ways. Therefore, selecting the optimal inspection frequency often involves maintaining a balance between the favorable and unfavorable results of the selection. Before selecting an inspection frequency, the material's grain structure and thickness, and the discontinuity's type, size, and probable location should be considered. As frequency increases, sound tends to scatter from large or course grain structure and from small imperfections within a material. Cast materials often have coarse grains and other sound scatters that require lower frequencies to be used for evaluations of these products. Wrought and forged products with directional and refined grain structure can usually be inspected with higher frequency transducers.
Since more things in a material are likely to scatter a portion of the sound energy at higher frequencies, the penetrating power (or the maximum depth in a material that flaws can be located) is also reduced. Frequency also has an effect on the shape of the ultrasonic beam. Beam spread, or the divergence of the beam from the center axis of the transducer, and how it is affected by frequency will be discussed later.
It should be mentioned, so as not to be misleading, that a number of other variables will also affect the ability of ultrasound to locate defects. These include the pulse length, type and voltage applied to the crystal, properties of the crystal, backing material, transducer diameter, and the receiver circuitry of the instrument.
6. Reflection and Transmission Coefficients (Pressure)
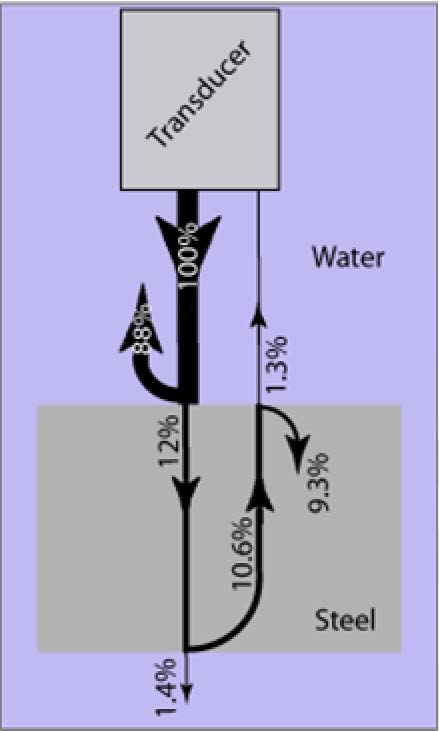
In the picture above, the energy reflected at a water-stainless steel interface is 0.88 or 88%. The amount of energy transmitted into the second material is 0.12 or 12%. The amount of reflection and transmission energy in dB terms is -1.1 dB and -18.2 dB respectively. The negative sign indicates that individually, the amount of reflected and transmitted energy is smaller than the incident energy. If reflection and transmission at interfaces is followed through the component, only a small percentage of the original energy makes it back to the transducer, even when loss by attenuation is ignored. For example, consider an immersion inspection of a steel block. The sound energy leaves the transducer, travels through the water, encounters the front surface of the steel, encounters the back surface of the steel and reflects back through the front surface on its way back to the transducer. At the water steel interface (front surface), 12% of the energy is transmitted. At the back surface, 88% of the 12% that made it through the front surface is reflected. This is 10.6% of the intensity of the initial incident wave. As the wave exits the part back through the front surface, only 12% of 10.6 or 1.3% of the original energy is transmitted back to the transducer.
7. Data Presentation
Ultrasonic data can be collected and displayed in a number of different formats. The three most common formats are known in the NDT world as A-scan, B-scan and C-scan presentations. Each presentation mode provides a different way of looking at and evaluating the region of material being inspected. Modern computerized ultrasonic scanning systems can display data in all three presentation forms simultaneously.
A-Scan Presentation.
The A-scan presentation displays the amount of received ultrasonic energy as a function of time. The relative amount of received energy is plotted along the vertical axis and the elapsed time (which may be related to the sound energy travel time within the material) is displayed along the horizontal axis. Most instruments with an A-scan display allow the signal to be displayed in its natural radio frequency form (RF), as a fully rectified RF signal, or as either the positive or negative half of the RF signal. In the A-scan presentation, relative discontinuity size can be estimated by comparing the signal amplitude obtained from an unknown reflector to that from a known reflector. Reflector depth can be determined by the position of the signal on the horizontal sweep.
This picture shows a typical A-scan response from a perpendicular reflector:
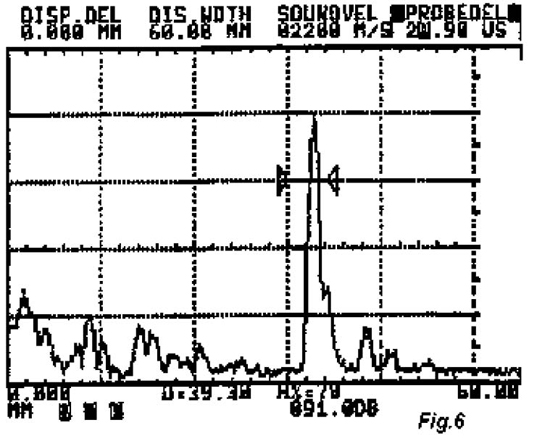
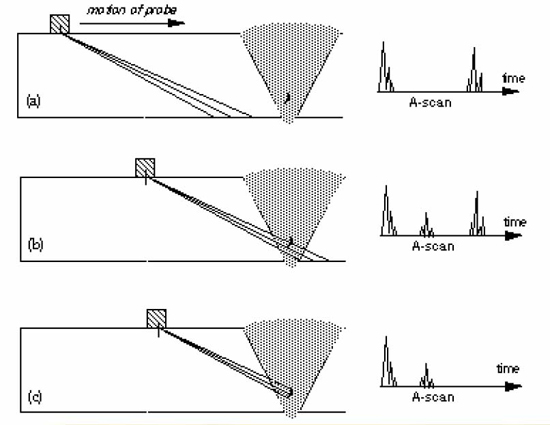
The bottom figure shows the expected series of A-scans.
B-Scan Presentation.
The B-scan presentation is a profile (cross-sectional) view of the test specimen. In the B-scan, the time-of-flight (travel time) of the sound energy is displayed along the vertical axis and the linear position of the transducer is displayed along the horizontal axis. From the B-scan, the depth of the reflector and its approximate linear dimensions in the scan direction can be determined. The Bscan is typically produced by establishing a trigger gate on the A-scan. Whenever the signal intensity is great enough to trigger the gate, a point is produced on the B-scan. The gate is triggered by the sound reflecting from the backwall of the specimen and by smaller reflectors within the material.
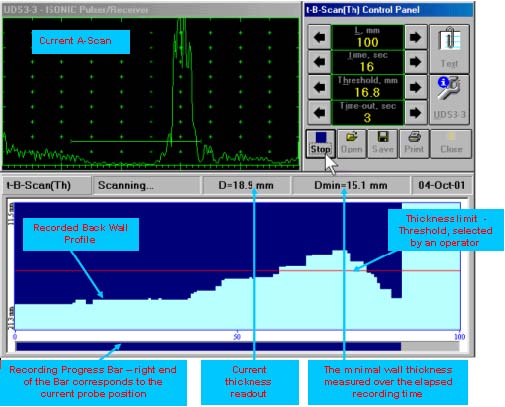
The figure above shows both A-scan and B-scan presentations.
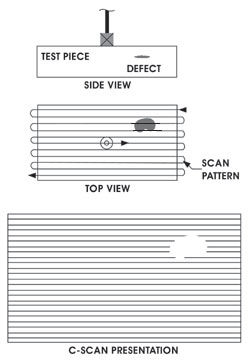
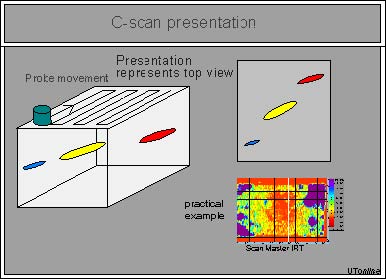
C-Scan Presentation.
The C-scan presentation provides a plantype view of the location and size of test specimen features. The plane of the image is parallel to the scan pattern of the transducer. C-scan presentations are produced with an automated data acquisition system, such as a computer controlled immersion scanning system. Typically, a data collection gate is established on the A-scan and the amplitude or the time-of-flight of the signal is recorded at regular intervals as the transducer is scanned over the test piece. The relative signal amplitude or the time-offlight is displayed as a shade of gray or a color for each of the positions where data was recorded. The C-scan presentation provides an image of the features that reflect and scatter the sound within and on the surfaces of the test piece.
High resolution scans can produce very detailed images. Below are two ultrasonic C-scan images of a US quarter. Both images were produced using a pulse-echo technique with the transducer scanned over the head side in an immersion scanning system. For the C-scan image on the left, the gate was setup to capture the amplitude of the sound reflecting from the front surface of the quarter. Light areas in the image indicate areas that reflected a greater amount of energy back to the transducer. In the C-scan image on the right, the
gate was moved to record the intensity of the sound reflecting from the back surface of the coin. The details on the back surface are clearly visible but front surface features are also still visible since the sound energy is affected by these features as it travels through the front surface of the coin.

C-Scan 3D Mode.
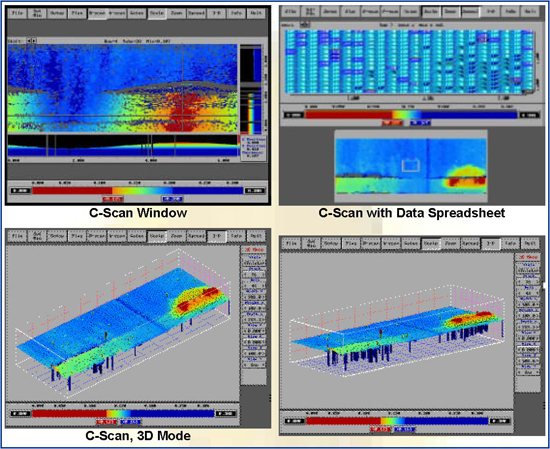
C-scan three-dimensional mode provides the operator a wider range of tools to interpret irregularities. The compact scanner size allows access to tubes other systems can't reach.
8. Conclusion
This report provides a simplified introduction to the NDT method and basic information of ultrasonic. We presented here information on the science involved in ultrasonic inspection, the equipment that is commonly used, some of the measurement techniques used, as well as other general information.
9. References
- NDT Resource Center
- Wikipedia
- SearchSecurity
- Ultrasonic testing and image processing for in-progress weld inspection
- TWI
Presented by: Sami El-Ali


